
Matcha particle size is best managed as a method-bound distribution tied to the finished product, not as one universal micron target. A buyer who accepts a bare average can receive powder that looks compliant on paper yet leaves grit, sediment, dust, or unstable filling on the line. The safer route is to define the measurement method, review the fine and coarse tails, and confirm performance in the intended matrix. Buyers comparing wholesale matcha options should make that work part of sample approval.
Milling, screening, handling, sampling, and dispersion can change what a laboratory reports. Different preparation conditions may create a false rejection or hide a real change. This guide turns particle-size data into decisions for beverages, blends, packaging, and lot review.
Matcha particle size should be reported as a distribution with its method, sample preparation, dispersion conditions, units, and distribution basis. Buyers should compare D10, D50, and D90 only when those conditions match, then verify the powder in the actual product and process. A smaller value alone does not prove better matcha.
In short:
Key points:
- Specify the distribution, method, and basis together; a micron figure without them is incomplete.
- Treat laboratory data as a screening tool, then confirm wetting, texture, sediment, dust, and filling in use.
- Investigate unexpected results with repeat sampling and method alignment before accepting or rejecting a lot.
What matcha particle-size decision does a B2B buyer need to make?
A buyer needs to decide whether a powder's measured distribution is suitable and repeatable for a defined product and process. Matcha particle size is therefore an application specification, not a stand-alone grade certificate. It helps predict risks such as coarse residue in a latte, dust during bag dumping, or separation in a prepared drink.
Here is the useful distinction: the specification should describe the decision the number supports. A café blend may prioritize mouthfeel and whisking. A dry premix may care more about segregation, dust, and feeder consistency. A packaged drink needs a finished-matrix stability study because matcha remains dispersed solid material rather than becoming molecularly dissolved.
| Buyer decision | Evidence to request | Confirm in use |
|---|---|---|
| Approve a drinking powder | Method-bound distribution and retained sample | Mouthfeel, foam, residue |
| Approve a dry blend | Distribution plus blend trial | Segregation, dust, dose uniformity |
| Approve a beverage ingredient | Distribution plus dispersion record | Wetting, sediment, redispersibility |
| Release an incoming lot | Comparable lot result and trend | Short application check after any drift |
AdoroHu Matcha's E-1 to E-7 and O-1 to O-6 codes describe commercial product tiers and sensory position. They do not establish a universal particle-size limit. Keep the code, lot identity, test result, and approved application sample as separate pieces of evidence.
Key Takeaway: Define the business decision first, then choose the particle-size evidence that can support it.
Why is a matcha particle-size distribution more useful than one average?
A distribution is more useful because two powders can share a median while carrying very different fine and coarse fractions. A single average conceals those tails, although the tails may drive dust, grit, slow wetting, or sediment. That is why a purchasing specification should name both the distribution statistics and their basis.
In practice, distribution basis matters. Laser diffraction commonly reports an equivalent-spherical distribution by volume, while microscopy can describe observed shapes and sieving separates material through an aperture. These methods do not count the same property. The ISO 13320 laser-diffraction scope also makes clear that sample preparation, dispersion, optical assumptions, and particle shape affect comparability.
The consequence is direct: a supplier's volume-based median cannot be treated as equal to a microscope count median. Doing so can trigger avoidable disputes or approve a coarse tail that the headline value hides.
Key Takeaway: Never approve an “average micron size” until the method, basis, and full distribution are attached.
How do D10, D50, and D90 explain matcha texture and coarse tails?
D10, D50, and D90 locate points on a cumulative particle-size distribution and help separate the fine end, median, and coarse tail. For a volume-based result, D90 means 90% of the measured particle volume is below that diameter under the stated method. It does not mean 90% of individual particles by count.
The buyer impact differs by statistic. D50 is useful for trend comparison, but D90 can expose a coarse fraction that contributes to residue or a rough finish. D10 can reveal changes in the fine fraction that may affect dust and wetting. None of the three predicts performance alone because shape, agglomeration, surface condition, formulation, and mixing also matter.
| Statistic | What it describes | Buyer question |
|---|---|---|
| D10 | Fine end of the cumulative distribution | Has the fine fraction shifted enough to change dust or wetting? |
| D50 | Median of the stated distribution | Is the lot centered near the approved reference? |
| D90 | Coarse end of the cumulative distribution | Could the coarse tail create grit, residue, or faster settling? |
Haraguchi, Imada, and Sawamura's 2003 Production and Characterization of Fine Matcha for Processed Food reported median diameters of 3.2 and 11.5 micrometres and D90 values of 6.9 and 39.4 micrometres. The finer sample settled more slowly in a short distilled-water bench test. These method-specific values are not purchase limits; they show why the center and coarse tail deserve separate review.
Key Takeaway: Read D50 for the center and D90 for the coarse-tail risk, while keeping the distribution basis attached.
Which sampling and dispersion conditions must be fixed for matcha powder?
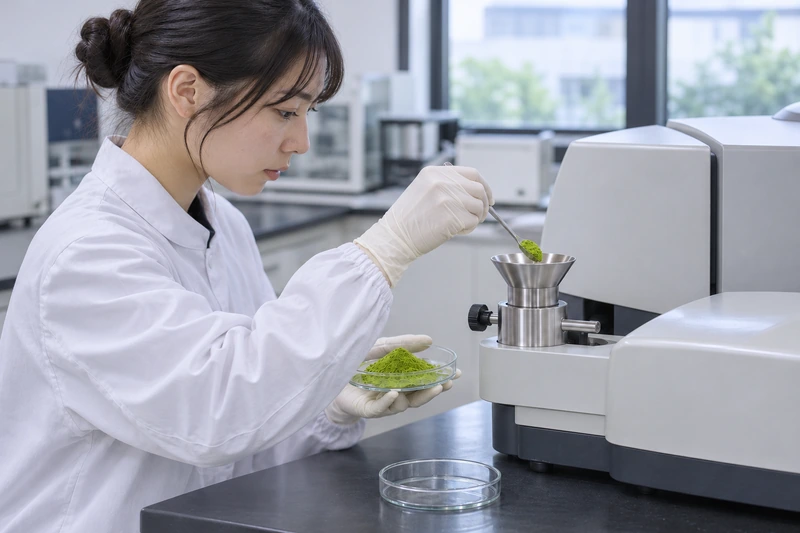
Sampling and dispersion conditions must be fixed because the laboratory can only measure the material actually presented to the instrument. Matcha powder may segregate during transport, compact in a liner, or form agglomerates after exposure to humidity. A scoop from the surface may not represent the carton or production lot.
At minimum, the method should identify the lot, sampling locations, sample conditioning, subdivision technique, dispersion medium, mixing energy, sonication if used, concentration, and analysis timing. The result should also state units and whether the distribution is volume-, area-, or number-based. These details let the buyer distinguish product variation from preparation variation.
Our facility uses 20 stone mills, 56 ball mills, 8 continuous ball mills, and ultrasonic screening capability. This range supports different processing routes, but it does not prove a specific lot's distribution. Buyers should still request a current method-bound result and evaluate the supplied sample.
Key Takeaway: Lock the sampling and dispersion instructions before setting a numerical tolerance.
How do laser diffraction, sieving, microscopy, and sensory checks differ?
These methods answer different questions, so they should be combined deliberately rather than treated as interchangeable. Laser diffraction offers rapid distribution data; sieving detects material retained above chosen apertures; microscopy shows particle shape and agglomerates; sensory checks reveal whether the observed distribution matters to the user.
| Method | Best use | Main limitation |
|---|---|---|
| Laser diffraction | Fast distribution trending across lots | Depends on dispersion and optical model |
| Sieving or screening | Coarse oversize and foreign clumps | Limited resolution for very fine powder |
| Microscopy | Shape, agglomerates, visible coarse fragments | Small field may not represent the lot |
| Sensory/application check | Texture, residue, visual settling | Depends on controlled preparation and panel judgment |
Our judgment is to use laser diffraction for routine trending and a second method only when it answers a defined risk. Avoid forcing sieve, microscopy, and laser values into one tolerance: the methods observe different physical properties, so apparent disagreement can waste time without improving release decisions.
The best pairing is often distribution data plus a controlled application test. Buyers can also use the matcha specification guide to keep the method, tolerance, and escalation rule in one document.
Key Takeaway: Choose each method for a specific question and do not convert unlike results as though they were equivalents.
How can agglomeration make two matcha laboratories report different results?
Agglomeration can make laboratories report different results because one procedure may break clusters apart while another measures them as larger units. Matcha particles can associate through electrostatic forces, moisture bridges, compression, or storage history. Dry and wet dispersion can therefore produce different distributions from the same sample.
Here is what to check first: compare sample conditioning, dispersion medium, mixing energy, sonication settings, refractive-index assumptions, obscuration, and repeatability. Then review the raw distribution curve, not only the reported D50. A shoulder or second peak may point to incomplete deagglomeration or a genuine coarse population.
Do not select the most aggressive dispersion merely because it produces the smallest number. In practice, use conditions that separate loose clusters without destroying particles, and document that endpoint. Excess energy can make a laboratory result look tidy while moving it farther from the powder's behavior in a customer's process.
Key Takeaway: Align dispersion energy and preparation before treating a cross-laboratory difference as a product defect.
How does matcha particle size affect wetting, suspension, mouthfeel, and dust?
Matcha particle size affects several behaviors at once, and improving one can worsen another. Finer material may reduce perceived grit and slow sedimentation under defined conditions, yet it can also hold air, resist initial wetting, and create more dust. Coarser material may wet differently but leave more visible residue or a rougher mouthfeel.
The matrix changes the outcome. Water, dairy, oat bases, sugar, protein, fat, stabilizers, heat, and homogenization all affect suspension and rheology. A bench water test is useful for screening, but it cannot establish shelf life or acceptance in a commercial formula. For café products, evaluate the actual matcha latte application with the intended temperature, mixer, hold time, and serving method.
Record wetting time, mixing energy, sediment height, redispersibility, visible specks, mouthfeel, and dust observations separately. This prevents one attractive result from hiding another operational cost.
Key Takeaway: Balance texture and settling against wetting and dust in the real recipe, process, and serving window.
How should matcha particle size be written into a purchasing specification?
A matcha particle-size clause should bind the product, method, sample preparation, statistics, units, tolerance, and response to an exception. The clause should also identify the approved reference lot or application result. Without those fields, a numerical range invites inconsistent interpretation.
A practical clause includes:
- Product code, lot identity, and sampling plan
- Instrument principle and method version
- Dry or wet dispersion conditions and optical inputs
- Distribution basis, units, D10/D50/D90, and repeatability rule
- Application check, retained sample, and out-of-trend response
Do not copy a supplier's internal mill target into the purchase specification unless it predicts your application. The stronger approach is to build tolerance from approved lots, method repeatability, and process capability. The related COA buyer guide helps separate a recurring specification from a lot-specific result.
Key Takeaway: Write a reproducible method and disposition rule, not a floating micron promise.
How should an out-of-trend matcha particle-size result be confirmed?
An out-of-trend result should be confirmed through sample identity, repeat preparation, retained-sample comparison, and application testing before disposition. Start by checking the lot code, container, laboratory method, analyst notes, and raw curve. Then repeat from a fresh representative portion rather than rerunning the same prepared vial.
Use a short decision sequence:
- Hold the affected material and confirm traceability.
- Repeat sampling and analysis under the agreed method.
- Compare the current, retained, and approved-reference distributions.
- Run the defined application check if the difference persists.
- Accept, conditionally use, investigate with the supplier, or reject based on documented evidence.
AdoroHu Matcha has in-house physical-chemical laboratory capability, which can support technical dialogue and sample investigation. It does not establish that a named particle-size test is performed on every lot. Buyers should agree the requested test, method, and reporting scope before ordering.
Key Takeaway: Confirm identity, sampling, and method before making a lot decision from one unexpected result.
When should application performance override a nominal matcha micron target?
Application performance should carry more weight when the agreed method is repeatable but the micron target does not predict the buyer's real failure mode. A powder that falls slightly outside a historical D50 may still deliver the approved texture, fill control, and sediment profile. Conversely, an in-range result may fail if the coarse tail or wetting behavior changed.
Our practitioner judgment is to keep the laboratory tolerance as an early-warning control and make the application test the final arbiter for significant changes. Avoid waiving a result informally. Document why the lot remains fit, which use conditions apply, and whether the specification needs formal revision.
This approach protects both sides. The buyer avoids rejecting usable material, while the supplier cannot use a passing headline number to dismiss a repeatable product failure. It also keeps particle size distinct from grade, origin, color, and food-safety release criteria.
Key Takeaway: Let the validated application decide fitness while the laboratory trend warns you where to look.
FAQ
- Does a smaller matcha particle size always mean higher quality?
- No. A smaller result may improve some texture or settling outcomes, but quality also depends on raw material, color, aroma, taste, processing, and the intended application.
- Is D90 a count of 90 percent of matcha particles?
- Not necessarily. In a volume-based laser-diffraction report, D90 means 90 percent of the measured particle volume is below that diameter under the stated method.
- Can supplier and buyer matcha particle-size results be compared directly?
- Only when sampling, preparation, dispersion, instrument method, optical inputs, units, and distribution basis are aligned or a method-bridging study supports the comparison.
- Does fine matcha dissolve in water or milk?
- Matcha is generally a suspension of plant particles, so even fine powder may settle over time. Finished-product testing should assess sediment and redispersibility under the intended use conditions.
- What should a buyer do after an unexpected particle-size result?
- Hold the material, confirm lot identity, repeat representative sampling and the agreed method, compare retained references, and run the defined application check before disposition.
Conclusion
A useful matcha particle-size specification joins a reproducible distribution method to an application decision. If you need a sample review with method, tolerance, and finished-product requirements aligned, contact AdoroHu Matcha with your matrix, process, and failure criteria.
Institutional Author: AdoroHu Matcha